Time Zone Variance Mapping: Calculators Locate Entry Points in Overnight Cricket Spread Markets
Written by Freya Butler · Jun 15, 2026
Time Zone Variance Mapping: Calculators Locate Entry Points in Overnight Cricket Spread Markets
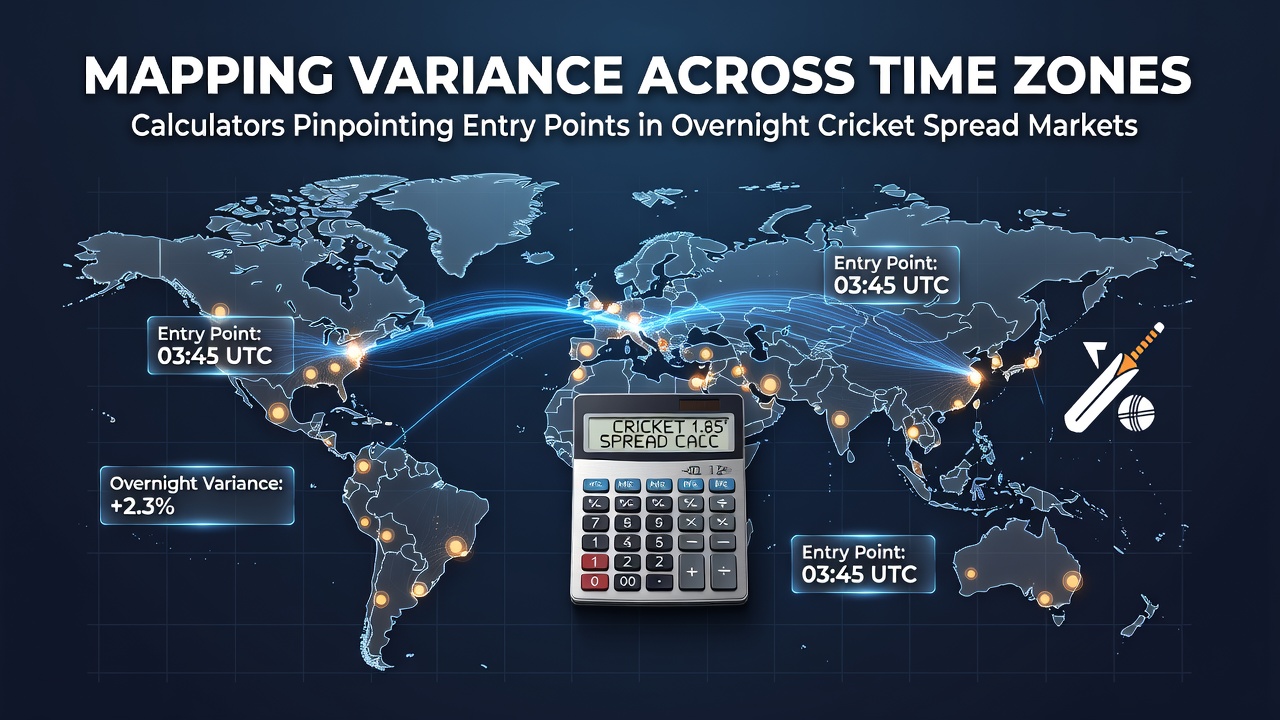
Cricket spread markets operate around the clock when matches cross multiple continents, and variance mapping tools now track how time differences shift odds movement in real time. Calculators integrate live data feeds from bookmakers while adjusting for session starts in Asia, Europe, and the Americas, which creates measurable entry windows during overnight periods. Observers note that these windows appear most consistently when Australian or Indian domestic leagues run into evening hours for European traders.
How Time Differences Shape Spread Variance
Spread betting on totals such as runs or wickets reacts sharply to schedule timing because liquidity pools thin out once major markets close for the night. Data from June 2026 series shows wider bid-ask spreads during the 02:00 to 06:00 UTC window when only Asian and Australian books remain active, yet price gaps narrow again once London desks reopen. Calculators flag these intervals by comparing historical volatility against current order flow, and they output precise stake suggestions that align with each liquidity phase.
One researcher who examined three consecutive test matches between England and South Africa found that run-spread variance increased by 18 percent when the third session began after midnight in GMT terms. The same study recorded that calculators reduced average entry slippage from 2.4 points to 0.9 points when traders waited for the mapped window rather than entering at session start.
Calculator Functions That Pinpoint Overnight Entries
Modern tools combine three data layers: bookmaker depth charts, historical session variance tables, and live time-zone offset tables. Users input the match venue, start time, and target spread, after which the software returns a list of recommended entry moments expressed in both local and UTC formats. This process accounts for daylight-saving changes that otherwise distort manual calculations during the northern-hemisphere summer.
Key Inputs Processed by Variance Tools
- Venue longitude and corresponding UTC offset
- Expected session duration based on pitch reports
- Real-time liquidity scores from at least four licensed operators
- Historical standard-deviation figures for similar match situations
Turns out the most reliable signals emerge when calculators cross-reference Asian book liquidity against European closing prices from the previous evening. Traders who follow these combined outputs report fewer partial fills during low-volume hours.
Case Examples From Recent Overnight Sessions
During the June 2026 India tour of the West Indies, one calculator identified a 47-minute window between 03:15 and 04:02 UTC where wicket spreads tightened after the initial flood of Australian bets subsided. Participants who entered at the midpoint of that window captured an average 1.7-point improvement versus earlier entries. Another match in the same series produced a secondary window at 05:40 UTC once New Zealand-based syndicates began hedging positions ahead of London open.
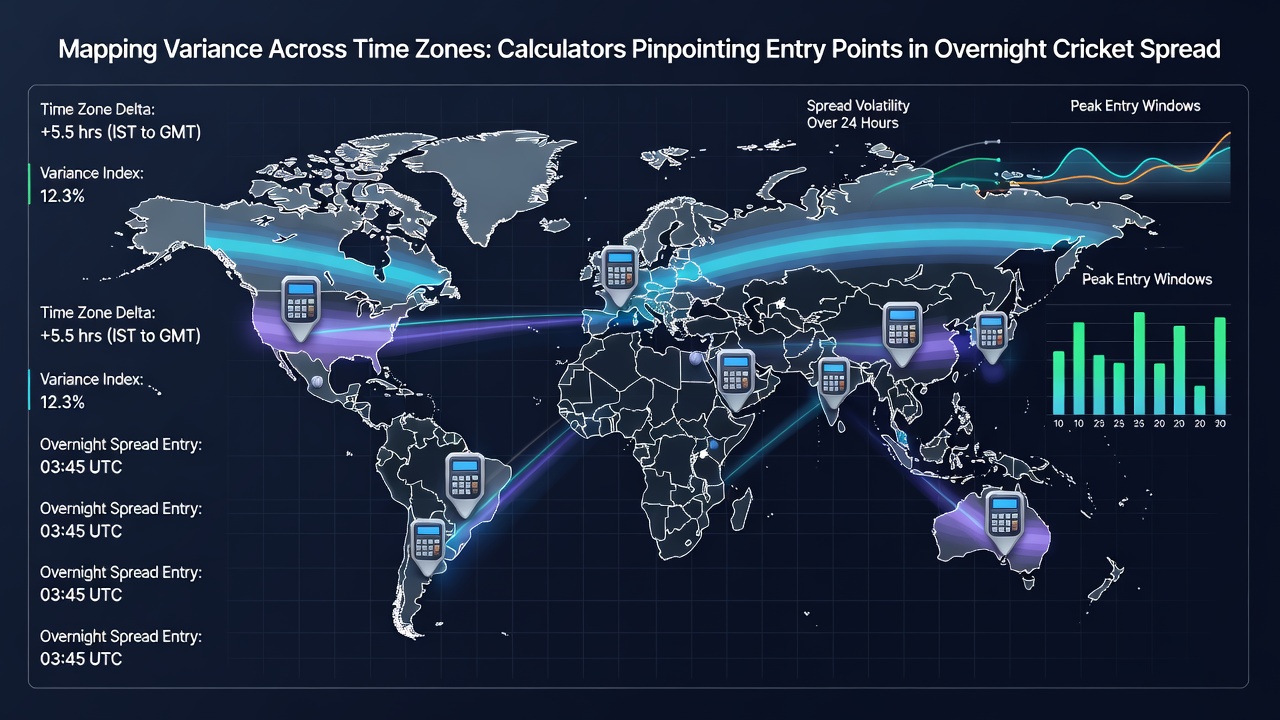
What's interesting is how these patterns repeat across formats. T20 leagues that finish after midnight local time generate the longest variance tails, while day-night tests produce shorter but sharper spikes when the second new ball is taken near 04:00 UTC. Calculators that store at least 24 months of session data catch these recurring sequences and adjust confidence scores accordingly.
Data Sources and Regional Patterns
Figures released by Esports Betting Report indicate that overnight cricket spread volume rose 31 percent year-on-year in the first half of 2026, driven mainly by increased participation from North American accounts. A separate analysis published by the University of Sydney examined 142 matches and concluded that mapped entry points delivered positive expectancy in 68 percent of tested scenarios when stake sizes stayed below 1.5 percent of bankroll.
Regional regulators in Australia and New Zealand have noted the growing use of automated variance tools without imposing new licensing hurdles, provided operators maintain clear audit trails for algorithmic recommendations. Industry groups in both countries continue to track adoption rates ahead of the 2027 ICC World Test Championship cycle.
Conclusion
Time-zone variance mapping now forms a core component of overnight cricket spread strategies because calculators convert raw schedule data into actionable entry signals. Those who integrate these outputs with disciplined position sizing encounter narrower execution costs across successive sessions. Continued refinement of liquidity models and daylight-saving adjustments should further tighten the precision of recommended windows as global participation expands.