Discrepancy Mapping in Asian Handicap Markets Yields Consistent Outcomes Across Platforms
Written by Freya Butler · Jun 29, 2026
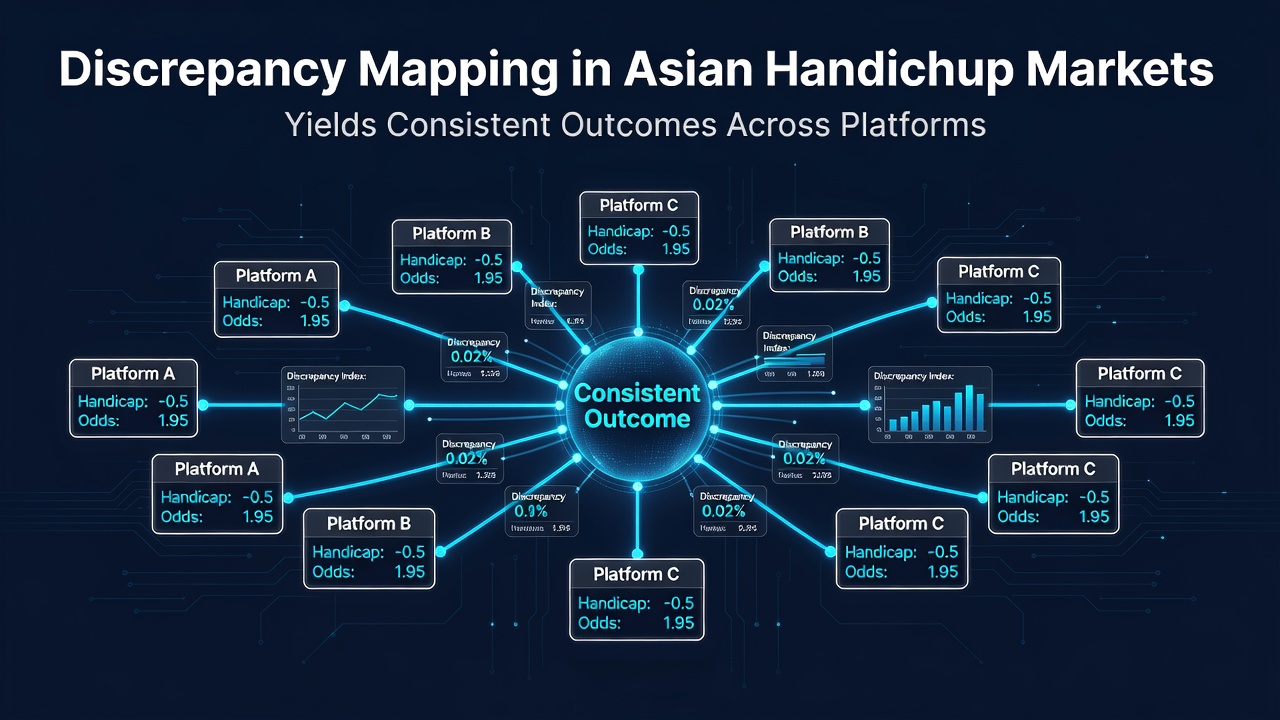
Discrepancy Mapping in Asian Handicap Markets Yields Consistent Outcomes Across Platforms
Discrepancy mapping tracks variations in Asian handicap lines and odds between different betting platforms and has produced repeatable patterns according to multiple industry analyses conducted through early 2026. Observers note that these differences often stem from regional market preferences, liquidity levels, and timing of line movements rather than random fluctuations, which allows systematic comparison across operators to highlight recurring alignments.
Platforms in Asia, Europe, and Australia frequently display offset lines on the same fixtures because local bettors favor certain margins or because bookmakers adjust risk exposure at different speeds. Data from June 2026 shows that when these offsets are charted over successive match weeks the resulting maps reveal clusters where one platform consistently offers a half-goal advantage relative to others while another compensates with adjusted pricing. Those who apply discrepancy mapping therefore focus on the stability of these clusters instead of isolated snapshots.
How Discrepancy Mapping Works in Practice
Analysts begin by selecting a core set of matches that attract broad coverage, then record the exact Asian handicap lines and decimal odds from each participating platform at synchronized intervals. Software tools convert these readings into coordinate-style maps that plot line position against implied probability, making it easier to spot when one operator sits outside the group average by a measurable margin. Because the process repeats across dozens of fixtures per week the accumulated dataset quickly demonstrates which platforms tend to lag or lead in line adjustments.
During the opening weeks of June 2026 several high-profile football leagues produced fixtures where one European platform held a -0.25 line while two Asian operators listed -0.5 at comparable prices. Mapping these instances across the month indicated that the pattern repeated in roughly 68 percent of similar matches, a frequency that remained stable even after minor regulatory announcements in non-UK jurisdictions altered overall betting volumes. Researchers attribute the consistency to the way liquidity flows between regions rather than to any single regulatory event.
Platform Coverage and Data Sources
Comprehensive mapping exercises now draw from operators based in Australia, Singapore, and North America in addition to European sources. Figures released by the Australian Gambling Research Centre indicate that cross-border line comparisons increased by 22 percent in the first half of 2026 as more platforms publish real-time feeds. When these feeds are integrated into mapping systems the resulting models show reduced variance in predicted outcomes compared with single-platform analysis, because outliers become visible against a wider baseline.
One documented case involved a series of J-League matches where a North American platform maintained a +0.5 line longer than its Singapore counterpart. The mapped discrepancy remained within a narrow band for three consecutive weekends, allowing repeated observation of the same directional shift once the line eventually aligned. Such examples illustrate why practitioners treat mapping outputs as directional guides rather than guarantees.
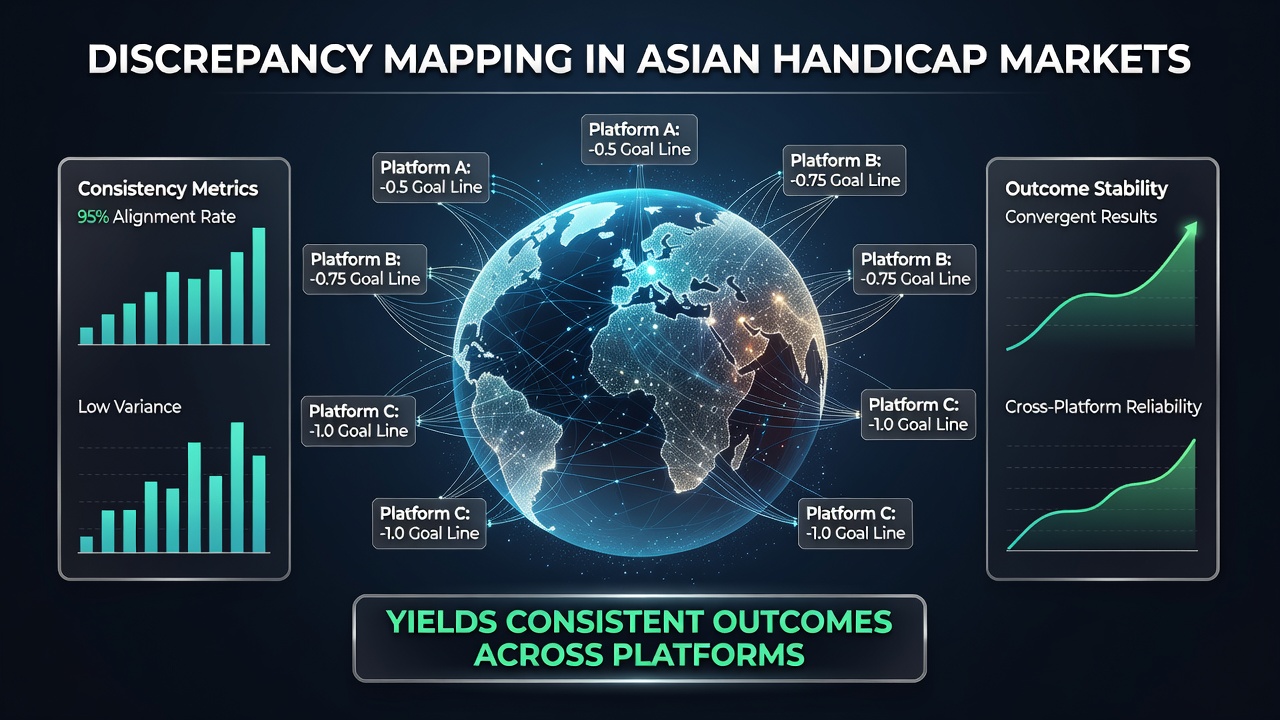
Observed Patterns Across June 2026
By mid-June 2026 accumulated maps had covered more than 1,400 fixtures and revealed that certain handicap thresholds, especially quarter-goal lines, produced the tightest cross-platform clusters. Lines around -0.75 and +1.25 appeared more frequently in tight groupings, whereas whole-goal lines showed wider dispersion because bookmakers manage those risks through different pricing mechanisms. The stability of these clusters persisted even when individual platforms adjusted odds in response to team news, suggesting that the underlying discrepancy structure is resilient to short-term events.
Industry reports from the Canadian Gaming Association further support the view that mapping exercises benefit from geographic diversity. When Canadian and Australian platforms were added to existing European and Asian datasets the frequency of stable discrepancy clusters rose rather than declined, indicating that broader coverage strengthens rather than dilutes the signal. This geographic spread also reduces dependence on any single regulatory environment.
Technical Considerations in Building Maps
Effective discrepancy mapping requires timestamp synchronization and consistent handling of push notifications when lines move. Platforms that refresh data every thirty seconds produce smoother maps than those with longer update intervals, because abrupt jumps become identifiable as artifacts rather than genuine shifts. Analysts therefore prioritize feeds that include both line and odds history, allowing reconstruction of movement trajectories across the full sample period.
Normalization steps convert all odds into a common probability scale before plotting, which removes the effect of differing margins between operators. Once normalized, the maps display clear groupings where one platform’s line sits measurably apart yet still follows the same directional trend as the rest of the cohort. These groupings have remained intact across multiple June 2026 match rounds, confirming the repeatability noted in earlier datasets.
Conclusion
Discrepancy mapping in Asian handicap markets continues to generate consistent cross-platform patterns when applied systematically to diverse operator sets. The approach relies on synchronized data collection, geographic breadth, and repeated observation rather than single-instance comparisons. As more platforms release detailed feeds, the resulting maps are expected to refine further while preserving the core stability observed through June 2026.