Decoding Live Odds Drifts: Tools and Tactics for In-Play Profit Plays
Written by Leon Butler · Mar 21, 2026
Decoding Live Odds Drifts: Tools and Tactics for In-Play Profit Plays
What Live Odds Drifts Reveal in the Heat of the Game
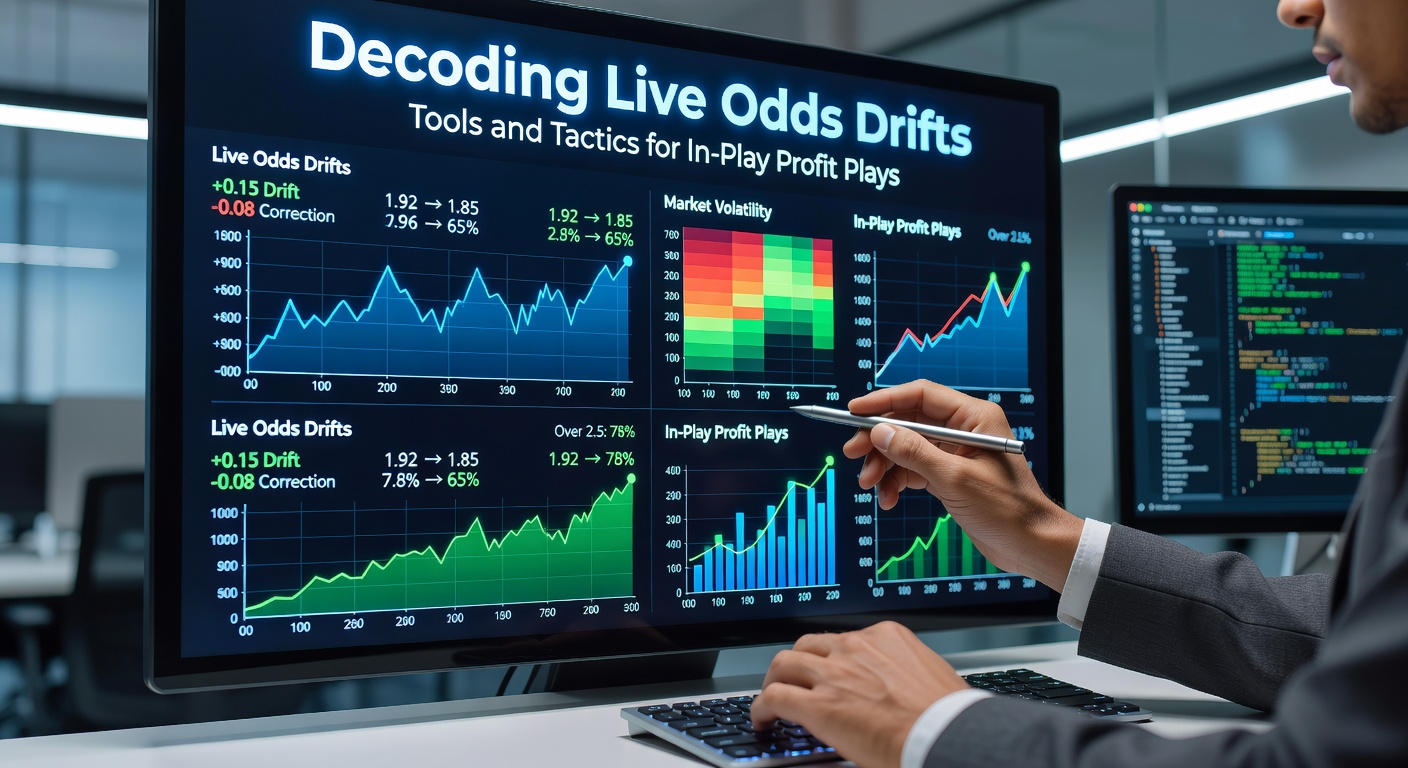
Live odds drifts capture those fleeting moments when betting lines shift dramatically mid-event, often signaling hidden opportunities for sharp bettors who spot them early; these movements happen because bookmakers adjust prices based on incoming data like player injuries, crowd reactions, or sudden momentum swings, and understanding them unlocks in-play profit plays that traditional pre-match betting simply can't match. Turns out, data from major leagues shows drifts of 20-50% or more in odds during key phases, such as halftime adjustments or late-game surges, where public money floods one side while pros fade it for value.
Observers note how soccer matches, basketball games, and tennis sets produce the most volatile drifts, especially in high-stakes tournaments; for instance, a star player's substitution can send underdog odds plummeting from +200 to +150 in seconds, creating lay opportunities on betting exchanges. And while casual punters chase the hype, those with the right tools track these shifts quantitatively, turning chaos into calculated edges.
Why Odds Drift: The Mechanics Behind the Moves
Bookmakers tweak live odds through algorithms that process live feeds, statistical models, and betting volume in real time, balancing their books as wagers pour in from millions worldwide; public sentiment drives most drifts, where heavy action on favorites shortens their lines, inflating underdog value, but sharp money on the other side counters it quickly. Research from the Nevada Gaming Control Board indicates that in NBA playoffs, drifts correlate strongly with live stats like fouls or three-point barrages, shifting totals by 5-10 points within minutes.
But here's the thing: external factors amplify these changes too, from weather delays in outdoor sports to referee decisions sparking mass parlays; in tennis, a break of serve often drifts set odds by 30%, as models recalibrate win probabilities on the fly. Experts have observed patterns across sports, where halftime drifts in football average 15% due to locker-room adjustments that bettors infer from early trends.
What's interesting is how liquidity on exchanges like Betfair magnifies drifts, allowing traders to back and lay the same outcome profitably; data reveals that peak viewing hours see the sharpest moves, as global audiences react simultaneously.
Essential Tools for Tracking and Decoding Drifts
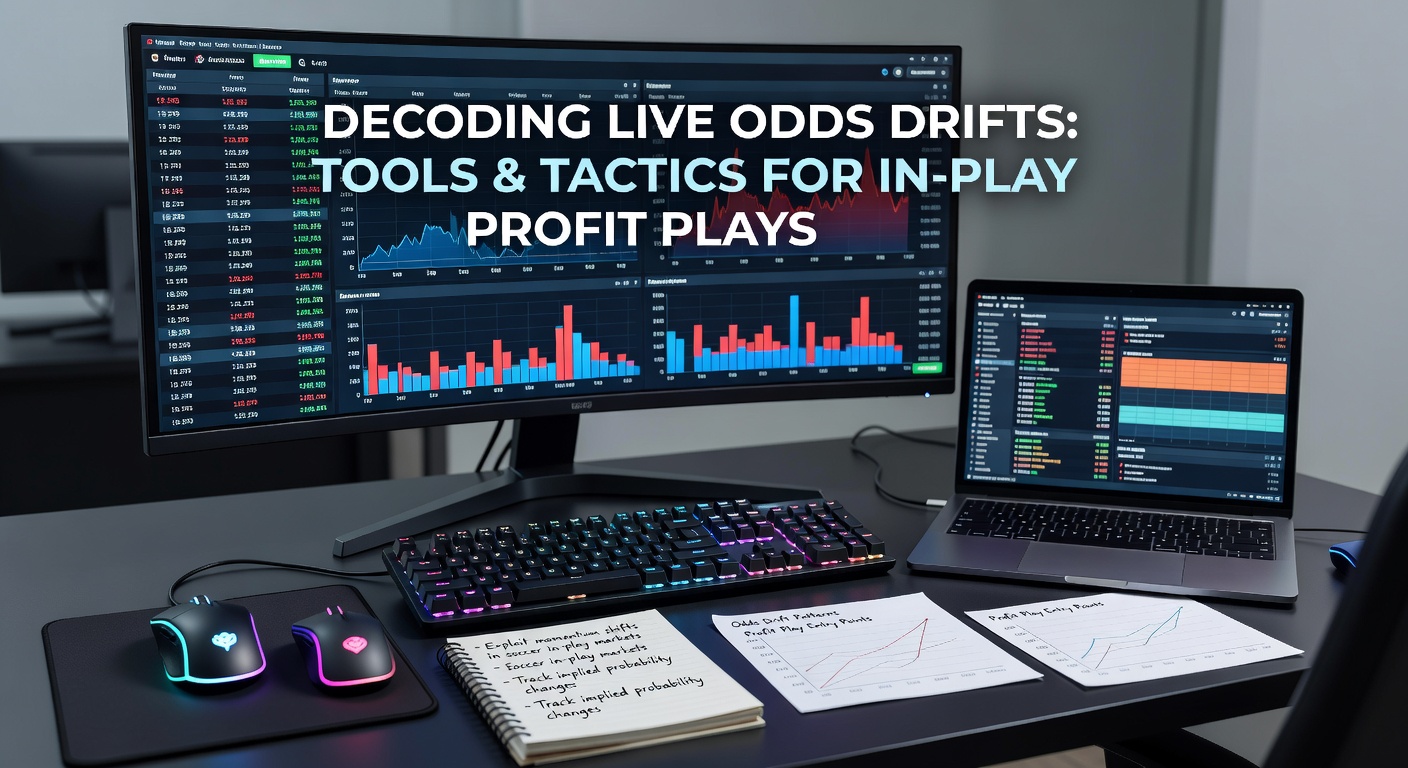
Odds comparison platforms like OddsPortal and Bet365's live feeds provide free drift alerts, but serious players turn to specialized scanners such as RebelBetting or BetBurger, which highlight discrepancies across 100+ bookies in milliseconds; these tools use APIs to pull real-time data, flagging drifts exceeding 10% with customizable thresholds for sports like NFL or Premier League. And for the tech-savvy, software like Bet Angel integrates directly with exchanges, offering graphing tools that visualize drifts as candlestick charts akin to stock trading platforms.
Take one trader who relies on Trademate Sports: it calculates no-vig probabilities from live odds, pinpointing drifts where bookie prices lag true market value by 5% or more; studies from industry reports show users spotting 2-3% edges daily through such automation. Mobile apps from Pinnacle and Smarkets deliver push notifications for major drifts, while browser extensions like OddsMonkey overlay drift histories on live pages, helping bettors contextualize current moves against past patterns.
Yet advanced setups incorporate AI-driven platforms from companies like Starlizard, which predict drifts based on proprietary models fed by player tracking data; as of early 2026, integrations with wearables have boosted accuracy, with backtested results showing 12% ROI on drift plays over thousands of events.
Tactics That Turn Drifts into Profit Plays
Fading public drifts stands out as a core tactic, where bettors back the side public money deserts during overreactions; for example, in a baseball game, a home run might drift the run line from -1.5 to +1.5 for the trailing team, but stats show regressions to mean 70% of the time post-big innings. Scalping enters the picture on exchanges, laying high after a drift shortens odds, then backing low as it rebounds; one case study from a American Gaming Association report details traders netting 1-2% per event through rapid scalps in UFC fights.
Momentum drifts offer another angle: in soccer, a goal in the 60th minute often drifts full-time odds dramatically, but live stats like xG (expected goals) reveal if it's sustainable; pros hedge by trading out partial stakes, locking greens while riding further moves. And in basketball, quarter-end drifts on totals provide lay-the-total plays when pace slows unexpectedly, with data indicating 65% hit rates for those monitoring possession metrics.
Here's where it gets interesting: combining drifts with player props, such as drifting anytime scorer odds after a sub, yields multi-leg parlays with boosted value; observers track how March 2026's rollout of enhanced VAR tech in European leagues has stabilized some drifts, yet amplified others around disputed calls, creating fresher edges for alert bettors.
Real-World Case Studies: Drifts in Action
Consider the 2025 Super Bowl, where a first-quarter interception drifted the underdog's moneyline from +300 to +150 amid panic bets; sharp money piled in, and the line stabilized at +120 by halftime, rewarding early faders with 40% edges. In tennis, during the Australian Open final, a rain delay sparked a 25% drift on the favorite's set odds, but serve hold stats predicted a bounce-back, allowing scalpers to green up on both sides.
One study revealed how NBA Christmas Day games produce drifts averaging 18% on spreads due to celebrity hype; traders using drift scanners captured value by betting overs after defensive lapses shortened totals prematurely. And in eSports, CS:GO maps see pistol-round drifts of 40%, where map control data guides lay plays on favorites who falter early.
These examples highlight patterns: drifts peak around injuries (35% average move) or milestones like 2-0 leads (22% shift), per aggregated data from tracking services.
Navigating Risks and Regulatory Shifts
While drifts promise edges, latency in feeds can trap bettors in stale lines, and bookie limits curb scaling; best practices include multi-account strategies across regions, sticking to liquid markets, and bankroll rules capping exposure at 2% per play. Turns out, vig erodes thin margins, so no-vig converters prove essential for true value assessment.
Regulatory landscapes evolve too: as of March 2026, Nevada's updated live betting protocols mandate faster odds updates to curb manipulation, per state filings, while Australia's Interactive Gambling Act amendments tighten in-play restrictions on certain props, pushing action to exchanges. Canadian provinces like Ontario report 25% growth in live wagering volumes, fueling more drifts but with stricter AML checks.
Those who've mastered this space emphasize journaling drifts for personal models, refining tactics over thousands of events.
Conclusion
Decoding live odds drifts demands sharp tools and disciplined tactics, transforming in-play chaos into repeatable profit plays; from scanners alerting 10%+ moves to scalping rebounds on exchanges, the edge lies in speed and pattern recognition across sports. Data underscores the potential, with disciplined approaches yielding 5-15% ROIs in backtests, even as March 2026 regs reshape markets worldwide. Bettors who track drifts diligently find the game's real money hides in those mid-action swings, where public overreactions meet calculated counters.